檔案:Uranium production world.PNG
出自六年制學程

此預覽的大小:800 × 351 像素. 其他解析度:1,425 × 625 像素。
完整解析度 (1,425 × 625 像素,檔案大小:59 KB,MIME類型:image/png)
摘要
| 描述 |
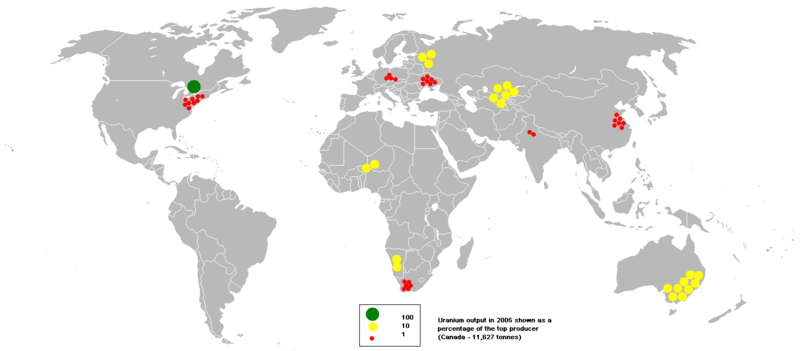
English: This bubble map shows the global distribution of uranium output in 2005 as a percentage of the top producer (Canada - 11,627 tonnes).
This map is consistent with incomplete set of data too as long as the top producer is known. It resolves the accessibility issues faced by colour-coded maps that may not be properly rendered in old computer screens. Data was extracted on 29th May 2007. Source - http://www.bgs.ac.uk/mineralsuk/free_downloads/home.html#WMP Based on en:Image:BlankMap-World.png |
| 日期 | 2007年5月29日 (原始上傳日期) |
| 來源 | Transferred from en.wikipedia to Commons by Jklamo using CommonsHelper. |
| 作者 | 英文維基百科的Anwar saadat |
| 其他版本 | arabic |
授權條款
英文維基百科的Anwar saadat,此作品的版權所有人,決定用以下授權條款發佈本作品:
此檔案採用創用CC 姓名標示-相同方式分享 3.0 未在地化版本授權條款。
姓名標示: 英文維基百科的Anwar saadat
- 您可以自由:
- 分享 – 複製、發佈和傳播本作品
- 重新修改 – 創作演繹作品
- 惟需遵照下列條件:
- 姓名標示 – 您必須指名出正確的製作者,和提供授權條款的連結,以及表示是否有對內容上做出變更。您可以用任何合理的方式來行動,但不得以任何方式表明授權條款是對您許可或是由您所使用。
- 相同方式分享 – 如果您利用本素材進行再混合、轉換或創作,您必須基於如同原先的相同或兼容的條款,來分布您的貢獻成品。
原始上傳日誌
The original description page was here. All following user names refer to en.wikipedia.
- 2007-05-29 15:21 Anwar saadat 1425×625× (60286 bytes) This bubble map shows the global distribution of uranium output in 2005 as a percentage of the top producer (Canada - 11,627 tonnes). This map is consistent with incomplete set of data too as long as the top producer is known. It resolves the accessibili
檔案歷史
點擊日期/時間以檢視當時出現過的檔案。
| 日期/時間 | 縮圖 | 維度 | 使用者 | 註解 | |
|---|---|---|---|---|---|
| 目前 | 2008年10月31日 (五) 09:40 | | 1,425 × 625(59 KB) | File Upload Bot (Magnus Manske) | {{BotMoveToCommons|en.wikipedia}} {{Information |Description={{en|This bubble map shows the global distribution of uranium output in 2005 as a percentage of the top producer (Canada - 11,627 tonnes). This map |
連結
以下的1個頁面連接到本檔案: